Texas New Home Sales Slow to Start 2026
HomesUSA.com reports lower inventory, softening prices
DALLAS, Feb. 23, 2026 (GLOBE NEWSWIRE) -- Texas new home sales fell nearly 5% in January, declining to 5,373 from 5,673 in December, according to the latest HomesUSA.com Texas New Home Sales Report.
New home sales were down nearly 6% year-over-year compared to January 2025. The average Days on Market rose more than 13% from a year ago. Pending sales, a measure of future sales activity, declined over 7% year over year. Inventory was up, as active listings were up more than 9% than in January 2025.
The HomesUSA.com Texas New Home Sales Report exclusively uses data reported to the local Multiple Listing Services, the most comprehensive, current, and accurate information, from the REALTOR® Associations of North Texas, Houston, Austin, and San Antonio. All averages are based on three-month moving averages to capture seasonality and remove anomalies.
New home sales across Texas declined in January to 5,373, down from 5,673 in December, a decrease of nearly 5%. Year-over-year, sales were down nearly 6%. Houston led all major markets with 1,998 sales, followed by Dallas-Fort Worth at 1,819, while San Antonio posted 795. New home sales were lower in all major markets except Austin, where total sales of 762 were up nearly 2% from December.
“January new home sales numbers reflect seasonality, and I believe the market will soon strengthen,” said Ben Caballero, CEO of HomesUSA.com and the nation’s top-ranked real estate agent.”

“Spring is always the best time for home sales,” Caballero added. “With this year’s tax cuts, consumers will have more money, then the spring selling season will kick in soon, followed by a new Fed Chairman focused on lowering interest rates. I will be surprised if housing doesn’t have a very good year.”
Days on Market was essentially flat statewide in January at 116.75 days, compared to 116.83 days in December. Austin, Houston, and San Antonio all saw Days on Market increase in January, rising to 110.17 days, 98.55 days, and 108.89 days, respectively. Dallas-Fort Worth moved in the opposite direction, declining to 143.71 days from 148.76 in December.
Average new home prices in Texas declined in January to $420,381, down from $429,077 in December. All four major markets posted month-over-month price declines. Austin remained the highest-priced market at $479,466, followed by Dallas-Fort Worth at $449,948. Houston averaged $396,723, while San Antonio posted $358,645.
Pending sales edged lower in January, with the statewide average slipping to 5,450 from 5,505 in December. Dallas-Fort Worth posted a slight increase in pending sales to 2,228 from 2,223. Austin also increased to 929 from 874. Houston declined to 1,463 from 1,532, while San Antonio fell to 829 from 876.
Texas new home inventory declined again in January to 35,412 active listings, down from 36,257 in December. Houston continued to account for the largest share of active listings with 15,886 homes, followed by Dallas-Fort Worth at 8,346. Austin posted 5,779 active listings, while San Antonio reported 5,401.
HomesUSA.com Texas New Home Sales Report and New Home Sales Index typically are issued before the monthly U.S. Commerce Department’s New Residential Sales Report. However, that report is currently on hold, last released on September 24, 2025. See this link for more information - https://www.census.gov/construction/soc/schedule.html.
About the Report
The HomesUSA.com monthly report covers closed sales recorded in MLSs by the 10th day of the following month. The report features 3-month moving averages for six essential market data points, including DOM, sales volume, sales prices, sales-to-list price ratio, pending sales, and active listings. We also provide a master chart for the 12-month moving averages for comparison. Caballero explains that the 3-month moving average indices track market seasonality, while the 12-month moving average removes seasonality and tracks the longer trend.
DAYS ON MARKET: Elevated but stable
Days on Market was flat in January at 116.75 days versus 116.83 days in December. Despite little month-over-month movement, the statewide average remains more than 13% higher than January 2025, reflecting a slower sales pace compared to a year ago.
Austin, Houston, and San Antonio all recorded month-over-month increases in DOM, rising to 110.17 days, 98.55 days, and 108.89 days, respectively. Dallas-Fort Worth moved in the opposite direction, declining to 143.71 days from 148.76 in December.
Note: New homes typically spend more time on the market than existing homes because many are listed while still under construction. Each MLS may calculate DOM differently, so direct comparisons may not always be reliable. (Chart: Texas New Homes Days on Market)
NEW HOME SALES: Most major markets drop
New home sales across Texas declined in January to 5,373 versus 5,673 in December, a decrease of nearly 5% month-over-month. Compared to January 2025, when 5,710 homes were sold, sales were down nearly 6% year-over-year.
Houston led all major markets with 1,998 sales, followed by Dallas-Fort Worth at 1,819. San Antonio posted 795 sales, while Austin recorded 762. Austin was the only major market to post a month-over-month increase, with sales up nearly 2% from December. (Chart: Texas New Home Sales)
NEW HOME PRICES: Statewide average slips
Average new home prices in Texas declined in January to $420,381 versus $429,077 in December, a decrease of about 2% month-over-month. All four major markets posted month-over-month price declines. Austin remained the highest-priced market at $479,466, followed by Dallas-Fort Worth at $449,948. Houston averaged $396,723, while San Antonio posted $358,645. (Chart: Texas New Home Prices)
PENDING SALES: Future activity softens
Pending sales, a measure of future sales activity, declined in January to 5,450 versus 5,505 in December, a decrease of about 1% month-over-month. Compared to January 2025, pending sales were down more than 7% statewide. Dallas-Fort Worth posted 2,228 pending sales, up slightly from 2,223 in December. Austin also recorded a month-over-month increase, rising to 929 from 874. Houston declined to 1,463 from 1,532, while San Antonio fell to 829 from 876. (Chart: Texas Pending New Home Sales)
ACTIVE LISTINGS: Inventory continues to ease
Active listings declined in January to 35,412 versus 36,257 in December, a decrease of about 2% month-over-month. Compared to January 2025, active listings were up more than 9% statewide. Houston continued to lead the state with 15,886 active listings, though down from 16,244 in December. Dallas-Fort Worth declined to 8,346 from 8,737. Austin posted 5,779 listings, up slightly from 5,735 the prior month, while San Antonio decreased to 5,401 from 5,541. (Chart: Texas Active Listings)
SALES-TO-LIST PRICE RATIO: Holds steady
Texas new homes continued to sell close to asking price in January, with the average sales-to-list price ratio at 96.59%, flat from 96.58% in December. Austin slightly increased to 97.50% versus 97.34%, while Dallas-Fort Worth posted a marginal decline to 97.17% from 97.24%. Houston edged down slightly to 95.25% from 95.33%, and San Antonio rose to 97.90% from 97.78%, achieving the closest listing price to actual sales price among the major markets. (Chart: Texas Sales-to-List Price Ratio)
About the HomesUSA.com New Home Sales Index
The HomesUSA.com New Home Sales Index is reported as both a 3-month and 12-month moving average of the Days on Market for new homes listed in the local Multiple Listing Services (MLSs) for Dallas-Ft. Worth, Houston, Austin, ad San Antonio. Created by Ben Caballero in December 2017, it is the first Days on Market index to track the Texas new home market based on activity in its largest markets and includes homes listed while under construction. (Chart: 12-Month Moving Averages)
About Ben Caballero and HomesUSA.com®
Ben Caballero, founder and CEO of HomesUSA.com, is a three-time Guinness World Records title holder for “Most annual home sale transactions through MLS by an individual sell-side real estate agent – current.” Ranked by REAL Trends as America’s top real estate agent for home sales since 2013, Ben is the most productive real estate agent in U.S. history. He is the only individual real estate agent to reach nearly $4 billion in residential sales transactions in a single year ($3.93 billion in 2024), the first agent to exceed $3 billion (2022), the first to exceed $2 billion (2018–2020), and the first to exceed $1 billion (2015–2017). An award-winning innovator and technology pioneer, Ben works with more than 70 home builders in Dallas-Fort Worth, Houston, Austin, and San Antonio. Ben’s podcast series is available widely, including Apple Podcasts, Spotify, YouTube Music and YouTube. Learn more at HomesUSA.com | Twitter: @bcaballero - @HomesUSA | Facebook: /HomesUSAdotcom.
Note for journalists: You may contact Ben Caballero directly by email at ben@homesusa.com.
REALTOR® is a federally registered collective membership mark which identifies a real estate professional who is a member of the NATIONAL ASSOCIATION OF REALTORS® and subscribes to its strict Code of Ethics.
Media Contact:
Kevin Hawkins
(206) 866-1220
kevin@wavgroup.com
Image: Ben Caballero
https://bit.ly/ben-caballero-photo
Individual Chart images:
Chart: Days on Market – Thru Jan. 2026: https://homesusa.com/wp-content/uploads/2026/02/DOM-Chart.png
Chart: New Home Sales – Thru Jan. 2026: https://homesusa.com/wp-content/uploads/2026/02/New-Home-Sales-Chart.png
Chart: Sales Prices – Thru Jan. 2026: https://homesusa.com/wp-content/uploads/2026/02/Home-Prices-Chart.png
Chart: Pending New Home Sales – Thru Jan. 2026: https://homesusa.com/wp-content/uploads/2026/02/Pending-Sales-Chart.png
Chart: Active Listings – Thru Jan. 2026: https://homesusa.com/wp-content/uploads/2026/02/Active-Listings-Chart.png
Chart: Sales-to-List-Price Ratio – Thru Jan. 2026: https://homesusa.com/wp-content/uploads/2026/02/Sales-Price-Ratio-Chart.png
Chart: 12-Month Moving Averages – Thru Jan. 2026: https://homesusa.com/wp-content/uploads/2026/02/12MonthChart-DataOnly.png

![]()
Ben Caballero of HomesUSA.com

Ben Caballero, founder and CEO of HomesUSA.com is the nation's No. 1 ranked real estate agent since 2013.
Chart: Texas New Home Sales thru Jan. 2026
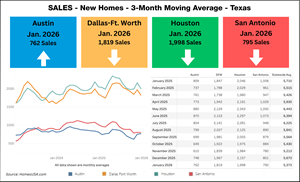
New home sales across Texas declined in January to 5,373 versus 5,673 in December, a decrease of nearly 5% month-over-month. Compared to January 2025, when 5,710 homes were sold, sales were down nearly 6% year-over-year..
Chart: Texas Days on Market - New Homes thru Jan. 2026

Days on Market was flat in January at 116.75 days versus 116.83 days in December. Despite little month-over-month movement, the statewide average remains more than 13% higher than January 2025, reflecting a slower sales pace compared to a year ago.
Chart: Texas New Home Prices thru Jan. 2026
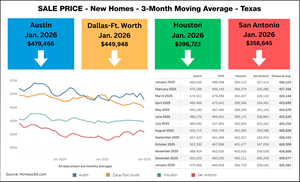
Average new home prices in Texas declined in January to $420,381 versus $429,077 in December, a decrease of about 2% month-over-month. All four major markets posted month-over-month price declines. Austin remained the highest-priced market at $479,466, followed by Dallas-Fort Worth at $449,948. Houston averaged $396,723, while San Antonio posted $358,645
Chart: Pending New Home Sales thru Jan. 2026
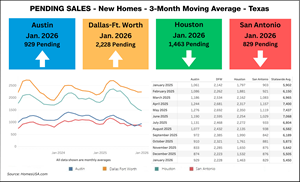
Pending sales, a measure of future sales activity, declined in January to 5,450 versus 5,505 in December, a decrease of about 1% month-over-month. Compared to January 2025, pending sales were down more than 7% statewide.
Chart: Active Listings New Home Sales thru Jan. 2026
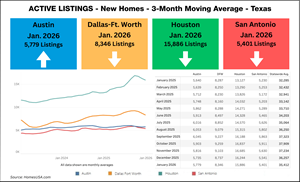
Active listings declined in January to 35,412 versus 36,257 in December, a decrease of about 2% month-over-month. Compared to January 2025, active listings were up more than 9% statewide.
Chart: Texas New Homes Sales-to-List-Price Ratio

Texas new homes continued to sell close to asking price in January, with the average sales-to-list price ratio at 96.59%, flat from 96.58% in December.
Chart: Texas New Home Sales 12-Month Moving Averages thru Jan. 2026

The monthly HomesUSA.com Texas New Home Sales Report includes 12-month moving averages of home sales, prices, price-to-list ratios, pending sales and active sales. While the 3-month moving average indices track market seasonality, the 12-month moving average removes the seasonality and tracks the longer trend.
Legal Disclaimer:
EIN Presswire provides this news content "as is" without warranty of any kind. We do not accept any responsibility or liability for the accuracy, content, images, videos, licenses, completeness, legality, or reliability of the information contained in this article. If you have any complaints or copyright issues related to this article, kindly contact the author above.
